News & Announcements
Service degradation report from September 15, 2020
On September 15th, 2020, customers across all our tiers experienced degradation of service, and in some cases, complete downtime. The incident lasted about 37 minutes.
We want you to know that we take any service disruption very seriously and we apologize to everyone this disruption impacted. It hurts us to ever see any of our customers experience downtime. We are on a mission to build a better web, and we want to provide world-class service at every tier. In this blog post, I will provide more insight into what happened, as well as the measures we’re already taking to mitigate the risk of future incidents.
What happened?
Netlify operates a highly available key/value data store to help us orchestrate our services and distribute site assets to our global edge nodes. This data store is composed of a cluster of high memory intensive virtual machines. Within this cluster, secondary nodes can take over primary responsibilities if the current primary node cannot fulfill its role any longer.
On Tuesday, September 15th, at 10:40 am UTC, our monitoring system started sending alerts of services unable to connect to the database. At 10:41 am UTC, our SRE team discovered the daemon that manages the state of the database cluster was down, leaving the cluster without available instances that could take the primary role. An initial attempt to restart this daemon didn't work.
A few days before this incident, our team had upgraded the database version that we use to keep up with major improvements in the engine. This is something we do regularly and test extensively. Our team performs regular primary step downs to validate that secondary servers in the cluster take over production traffic as expected. This change introduced a new variable to validate during the event.
The initial investigation surfaced that the database nodes had been terminated with a SIGABRT signal, which was not expected and we had never seen before. Unfortunately, the unclean shutdown caused some data to stay in the database journal without flushing it to disk. Since this was a problem that we had never seen before, we decided to shut down the cluster completely and rollback to the engine version that we were running before the upgrade. This decision added additional time to recovery.
Our graphs also indicated that the number of client connections to the database at the time of the incident had doubled from the usual amount of connections. You can see that spike and the connection drop when the cluster became unavailable in the graph below:
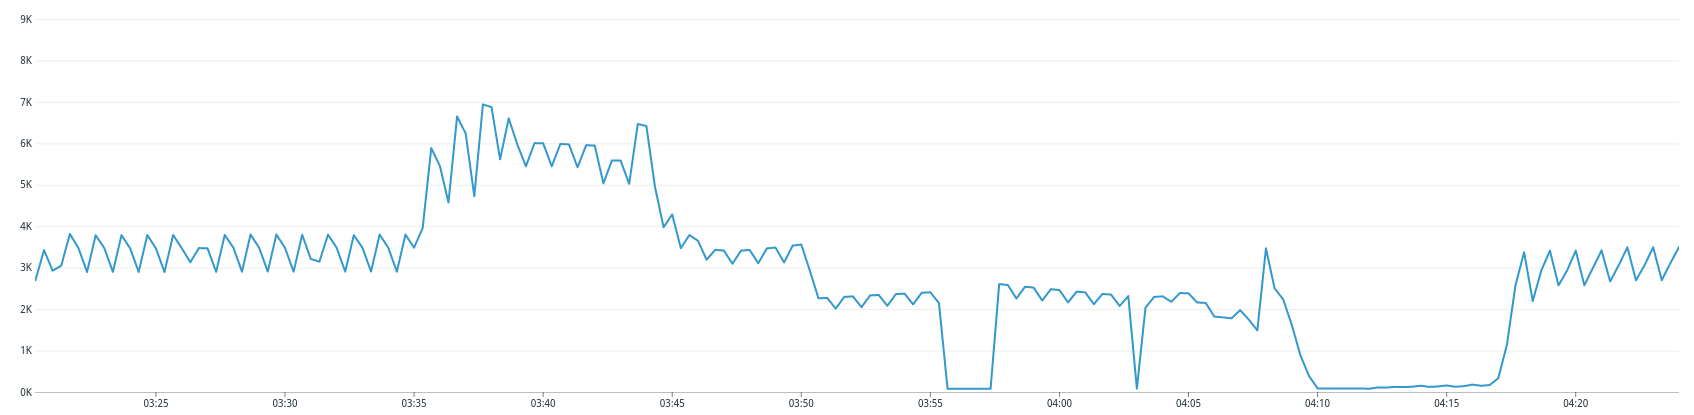
This graph gave us a clearer understanding of why we suddenly got those termination signals across our cluster.
The time when the client connections started to rise matched the time when one of our engineers deployed a dependency upgrade to our production infrastructure. That dependency happened to be the client library that we use to connect with our database. Before deploying any changes in production we verify them in two different environments, an isolated staging application cluster that connects to a dedicated database, and a canary node that processes a percentage of requests coming into this specific application. Unfortunately, we didn't have enough service instances running to scale the instance connection multiplier that this change caused, and the connections there were not numerous enough to detect this anomaly, so the deploy was promoted to production.
As the deploy completed rolling out to new nodes in our production cluster, the new client driver started to initialize connections based on a connection pool setting. The new client library was configured to use a default value much higher than our infrastructure could handle. This client library uses the same pool setting to connect to all nodes in the cluster; that way, if the primary database node steps down, the client can read and write from the newly elected primary node as soon as the cluster converges, and we don't need human intervention. Once the client connected to a primary with the higher connection pool setting it saturated the node causing a step down, which caused the cluster to pick a new primary. This ended up causing a cascade event across the cluster which ended when no more nodes could be elected as primary.
What are we doing to prevent this from happening in the future?
This incident made clear that our deployment strategy was not effective enough to catch unexpected changes when two or more systems interact with a high amount of traffic. We've already put in place a plan to improve our automatic canary analysis and perform better anomaly detection before changes get deployed to production. Our team is also evaluating ways to capture and replay large amounts of traffic to perform more automatic stress tests in different clusters. The goal of this initiative is to have more confidence that our production infrastructure is more resilient to unexpected events like the one described in this blog post.
Netlify's production infrastructure uses a microservices approach to divide clear responsibilities between services. Unfortunately, some of these microservices still rely on this main database to read and write information. This architectural approach is a single point of failure, but over the last few months, we have been working on several initiatives to rely less on this database, distribute information stores, and make those microservices more isolated. The goal of these initiatives is to prevent large cascade effects when one component in our infrastructure is unavailable. We'll share more information about this next month, as we make these new microservices that have much more defined responsibilities and isolation available.
Our initial assumption that the database version upgrade was the source of the issue here led to a longer mean time to recovery for this incident. We're evaluating different approaches to make it clearer across our engineering organization what change boundaries have been recently introduced within the infrastructure. This will help us reduce confounding factors in case of new incidents.
Conclusion
Finally, I personally apologize to all our customers affected by this incident. Our team works to make sure your content is always globally available and we let you down. Incidents like these are very costly for you and us, and it took us too long to solve it. We know that you trust Netlify, and everyone in our company is focused on living up to your expectations.
Thanks a lot for staying with me until this end of this post and for your support.


